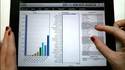
Making a Selection:
Drag a finger diagonally within a chart. Anchors will appear at the corners of the selection to allow the selection to be fine-tuned. Tap the green selection overlay to complete the selection. Tap outside to cancel the selection. To select on a filter, single tap the boxes to check or uncheck them.
The
"Undo"
icon takes you back to your previous data state before you made the selection. Or you can redo a selection using the
"Redo"
icon.
Changing Selection Modes:
The default Selection Mode is Replace. To change it, tap the "Selection: Replace" icon located on the toolbar. A menu will drop down for you to select add, subtract, or intersect selection.
Expanding a chart:
Place two fingers on the chart and move them apart diagonally ('spreading') to expand the chart to fill the display. Place two fingers on a chart and move them together diagonally ("pinching") to return the expanded chart to its original size and position. When a chart has been expanded an additional toolbar will be displayed along the bottom of the display that is specific to that chart (such as sort order, drill up/down, export data, etc.)
Excluding & Restoring Data:
To exclude data, restore data, and reselect all data tap the "Select…" icon located on the top toolbar. A menu will drop down with the following options: Select All, Select None, Toggle Selection, Exclude Selected, Exclude Unselected, and Restore Excluded. These operations act first on the core table (which is called out in the drop down menu), and then propagate to other tables. For example, if a selection was made on "football" from a bar chart on the sports table, and the core table was a list of people, then the exclusion will act first on the core table. If several football players also played other sports, then those other sports will show (up in addition to football) when the unselected data (non-football players) is excluded.
The "Select…" operations can also act first on the local table to which a chart is attached. To enable this, first expand the chart (see "Expanding a chart"), and then tap the "Select…" icon on the lower left corner of the chart. In the example above this will first exclude all non-football entries in the sports table, and then update the people and other tables. The people counts will be the same, but in this case only the football participation will be shown.
Using Color:
To view the "Color Legend" select the icon farthest to the right on the toolbar To change the field the charts are colored by, tap the "Color…" icon on the toolbar. A menu will drop down containing a list of fields from the core table to choose from.
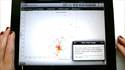
Display Brush-up within a Chart:
Single tap an item in a chart – for example a bar in a bar chart, a wedge in a pie chart, or a node in a scatterplot. A box will appear displaying stats about the total and selected data for that bar, wedge, node, etc..
Using a Hierarchy:
To drill up or drill down in a chart with a hierarchy, expand the chart. Then select the "Drill Down" or "Drill Up" icons from the toolbar along the bottom of the chart to move down or up in the hierarchy.
Zooming in on a Chart:
Double tap within a chart to zoom in. To move back out, double tap within the chart once more.
Scrolling within a Chart:
If a chart is zoomed (see above), dragging your finger horizontally or vertically within that chart will pan the chart in the direction of the drag. A long drag on an axis will pan the chart by the view amount. A short drag will pan the chart by 15% of the view.
Changing the Sort Order:
To change the order in which the bars, nodes, etc. are displayed in a chart, first expand the chart. Then tap the “Sort Order…” icon on the toolbar along the bottom of the chart. A menu will pop up giving you the option to sort by Label Order, Size, Selected, Percent Selected, Reverse Label, Reverse Size Order, Reverse Percent Selected, Original Order.
Searching a Data Sheet:
Expand the Data Sheet and tap the "Find…" icon on the toolbar along the bottom of the chart. The Find Text dialog window will appear. Chose the field in the data sheet you wish to search, then type the text you are searching for in the Search Text box and tap "Find". In order to restore data after a selection, tap the "Select…" icon on the top toolbar, and then "Select All", or tap "Undo".
Exporting a Page:
Tap the icon on the toolbar to the right of the selection mode icon (an arrow coming out of a box). A "Share Results" dialog window will appear. Type in the title and file name that you want for this document. Then choose between saving the page as a PDF or a Word document, and then tap "Create".
Exporting Data:
Expand the Data Sheet or Summary Sheet and tap the "Export…" icon on the toolbar along the bottom of the chart. An "Export Data" dialog window will appear. Type in the file name you wish to save the data under, then tap "Export". If there is no "Export…" icon then the project author did not enable permissions for data export.
Copying a Chart Image:
Expand the chart you wish to copy. Tap the icon on the toolbar along the bottom that is the farthest to the right (an arrow coming out of a box). A "Save Chart Image" dialog window will appear. Type in the file name you wish to save the image under and tap "Save".